Enhancing Usability for a
No-Code Development Platform
Introduction
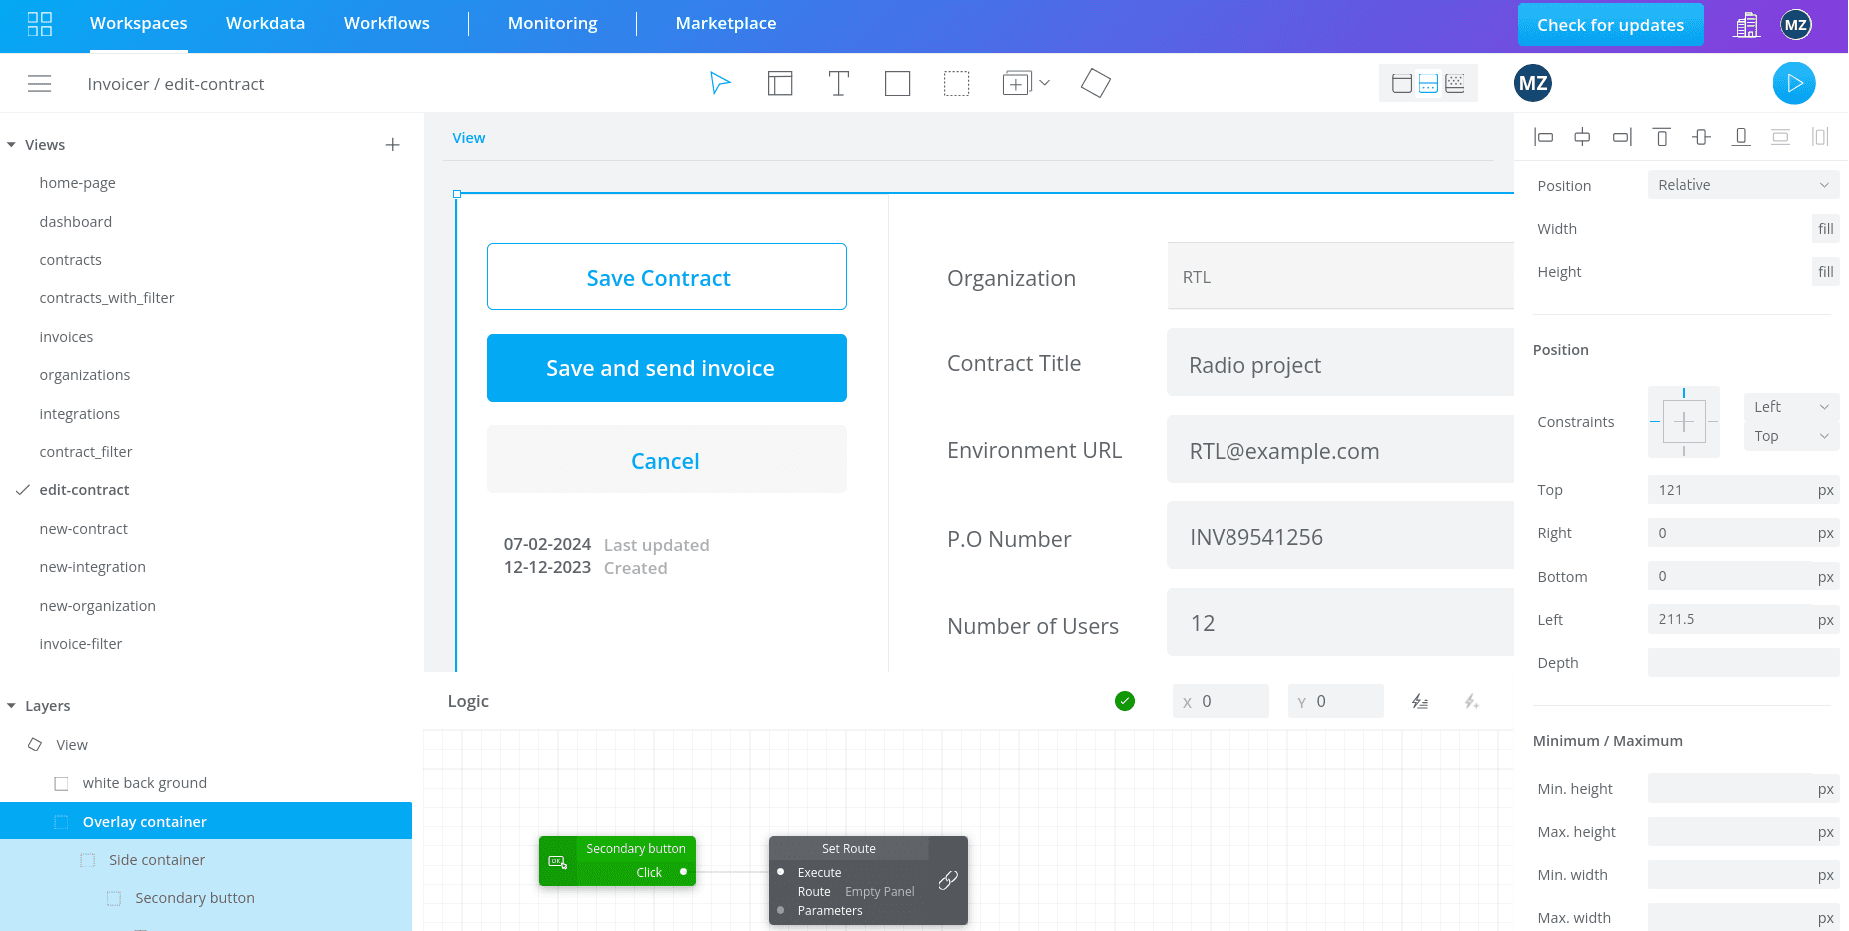
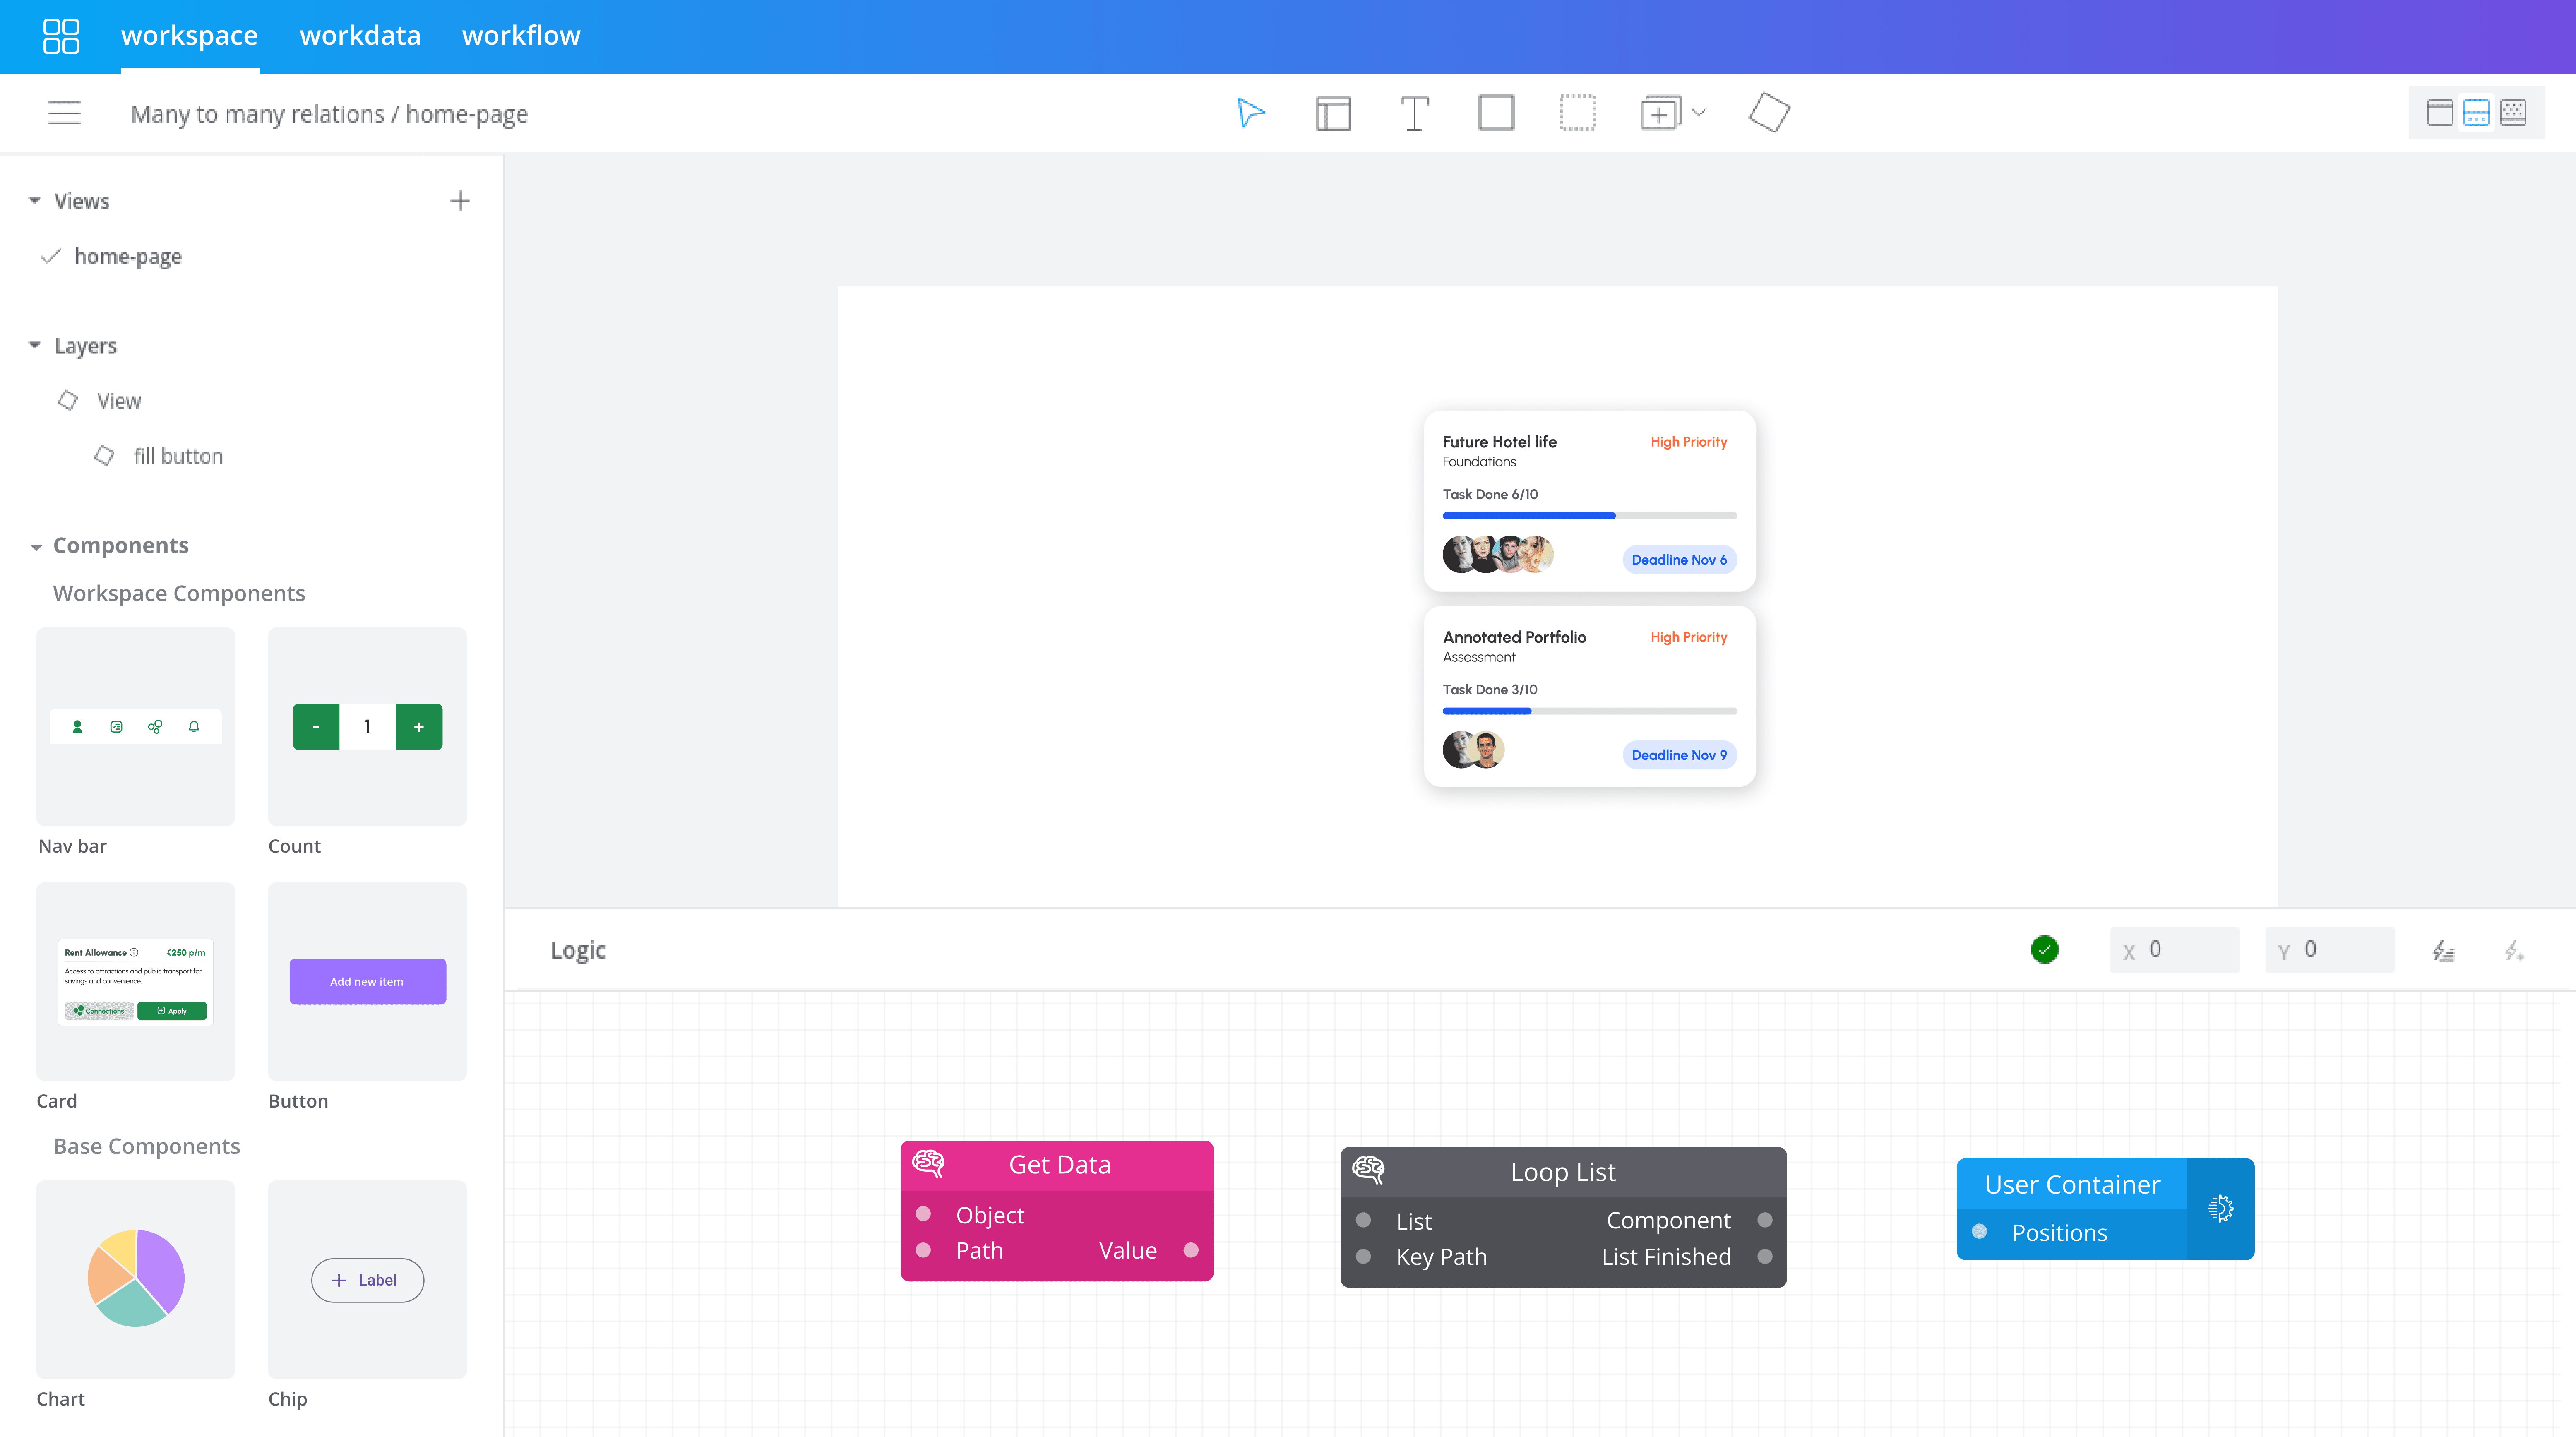
Pluxbox is a no-code development platform that enables users to design and develop applications for any media needs. Within the Workspace, users begin by designing the user interface (UI) of their application in the Artboard View. Once the UI is created, they can switch to the Logic View, where they add functionality by connecting logic blocks.
My role
As the UX/UI Designer on the product team, I collaborated closely with engineers, the product manager, and customer support. My key responsibilities included:
Run usability tests and interviews
Identify pain points
Design, prototype, and test solutions
Prioritize features by impact and feasibility
Share insights with stakeholders
The challenge
Users struggled with basic design actions due to unintuitive UI behavior, limited tool flexibility, and inconsistencies with expected design patterns. Key concerns included:
Inability to assign colors to containers
Inflexible and confusing component system
Limited design canvas
Poor discoverability of interactive blocks
These issues severely affected Pluxbox’s usability and learning curve, resulting in:
Final impact
The improvements of the Pluxbox platform’s design environment led to significant increase in usability and user satisfaction, measured through both user testing and post-launch analytics.
It resulted in a 25% decrease in the time required to complete design tasks, confirmed through user testing sessions.
Support requests dropped by 20%, as confirmed by customer support data, highlighting fewer usability challenges.
How we noticed?
The first signs of a problem came through customer support channels, where users expressed frustration with the design tools and logic blocks. Support request analysis helped me design more targeted usability tasks by highlighting real user struggles, ensuring the test scenarios reflected common pain points for more meaningful insights.
Usability testing
To identify pain points and limitations, I planned and conducted a usability test with 6 users. 3 of them were already Pluxbox customers and the other 3 were new to the platform but had experience with other design tools.
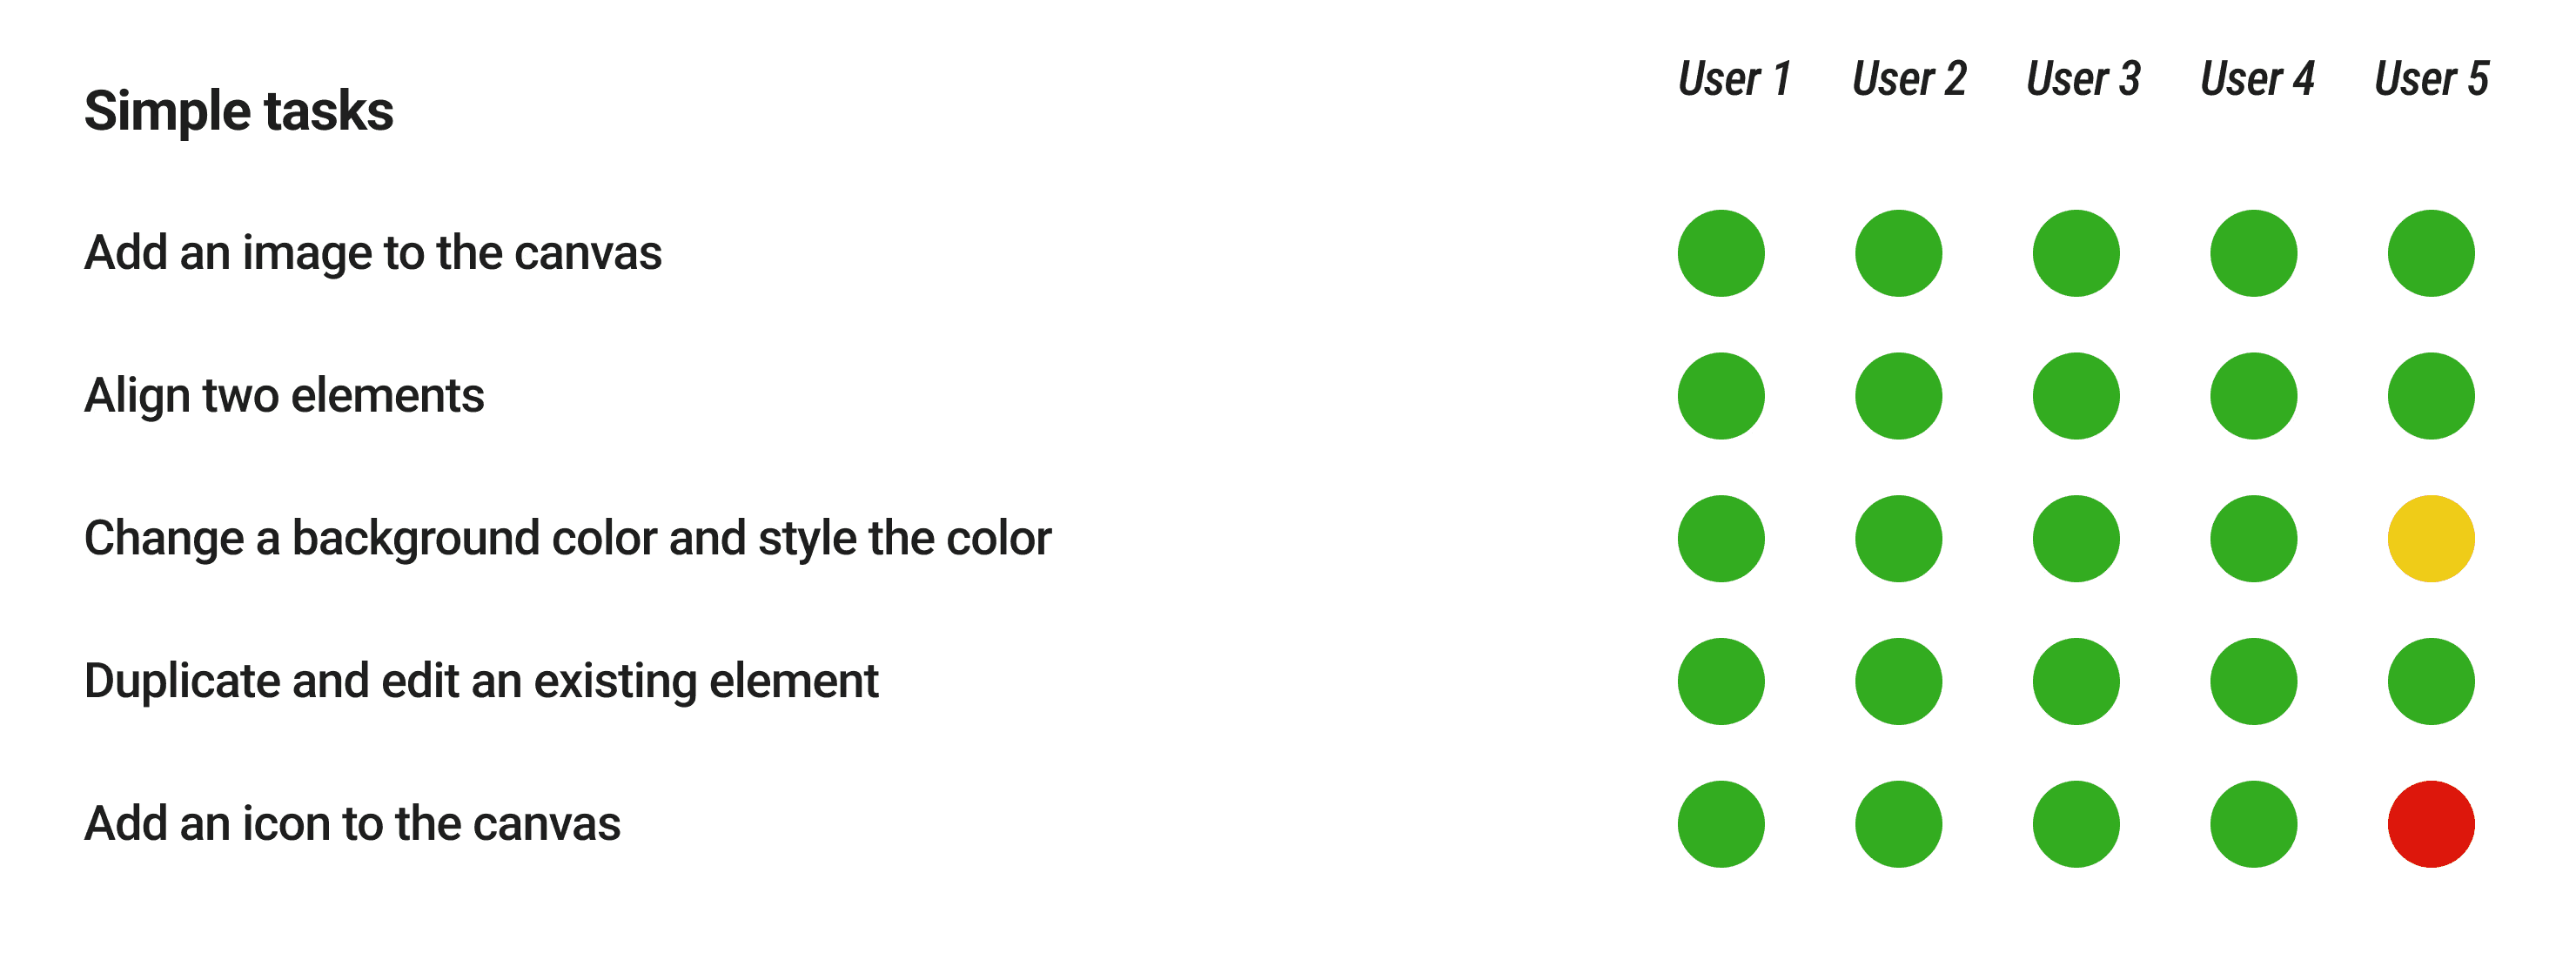
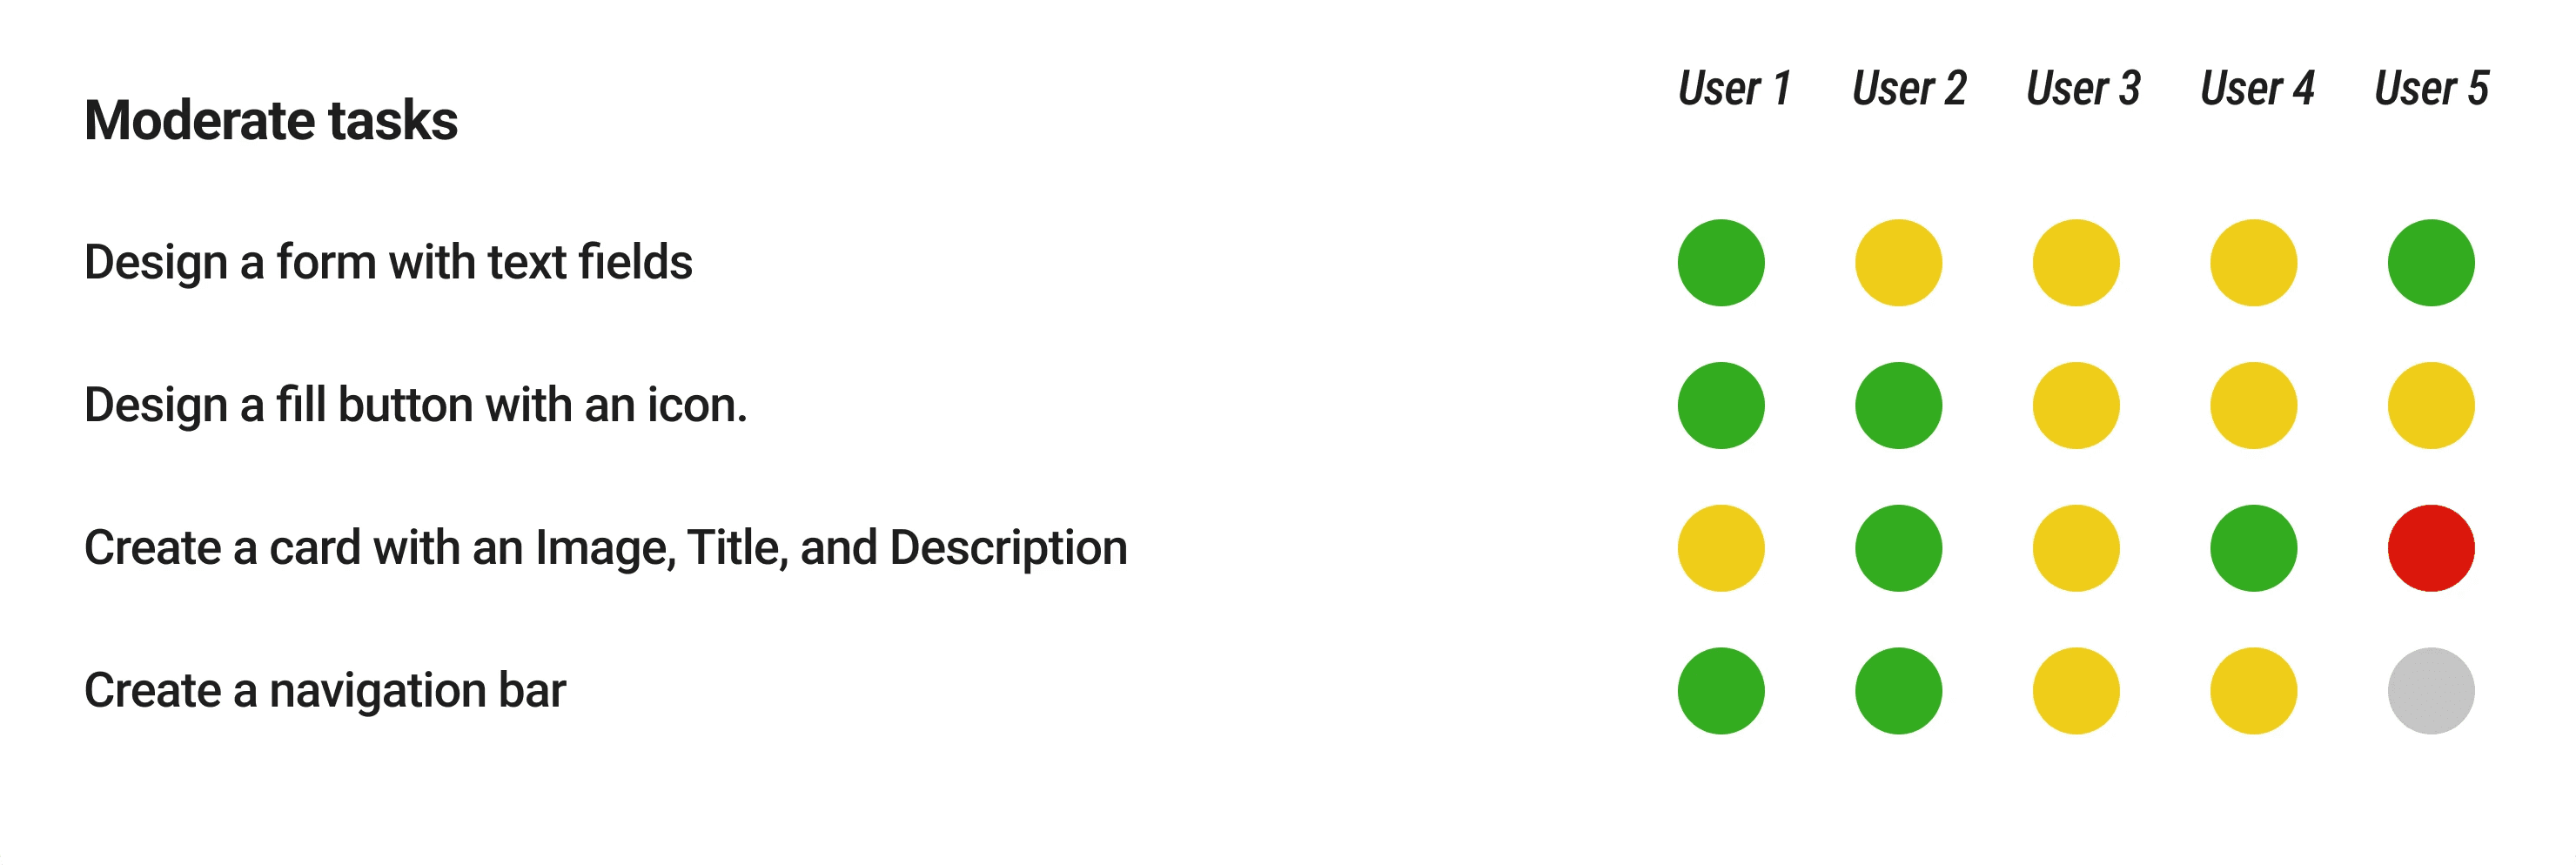
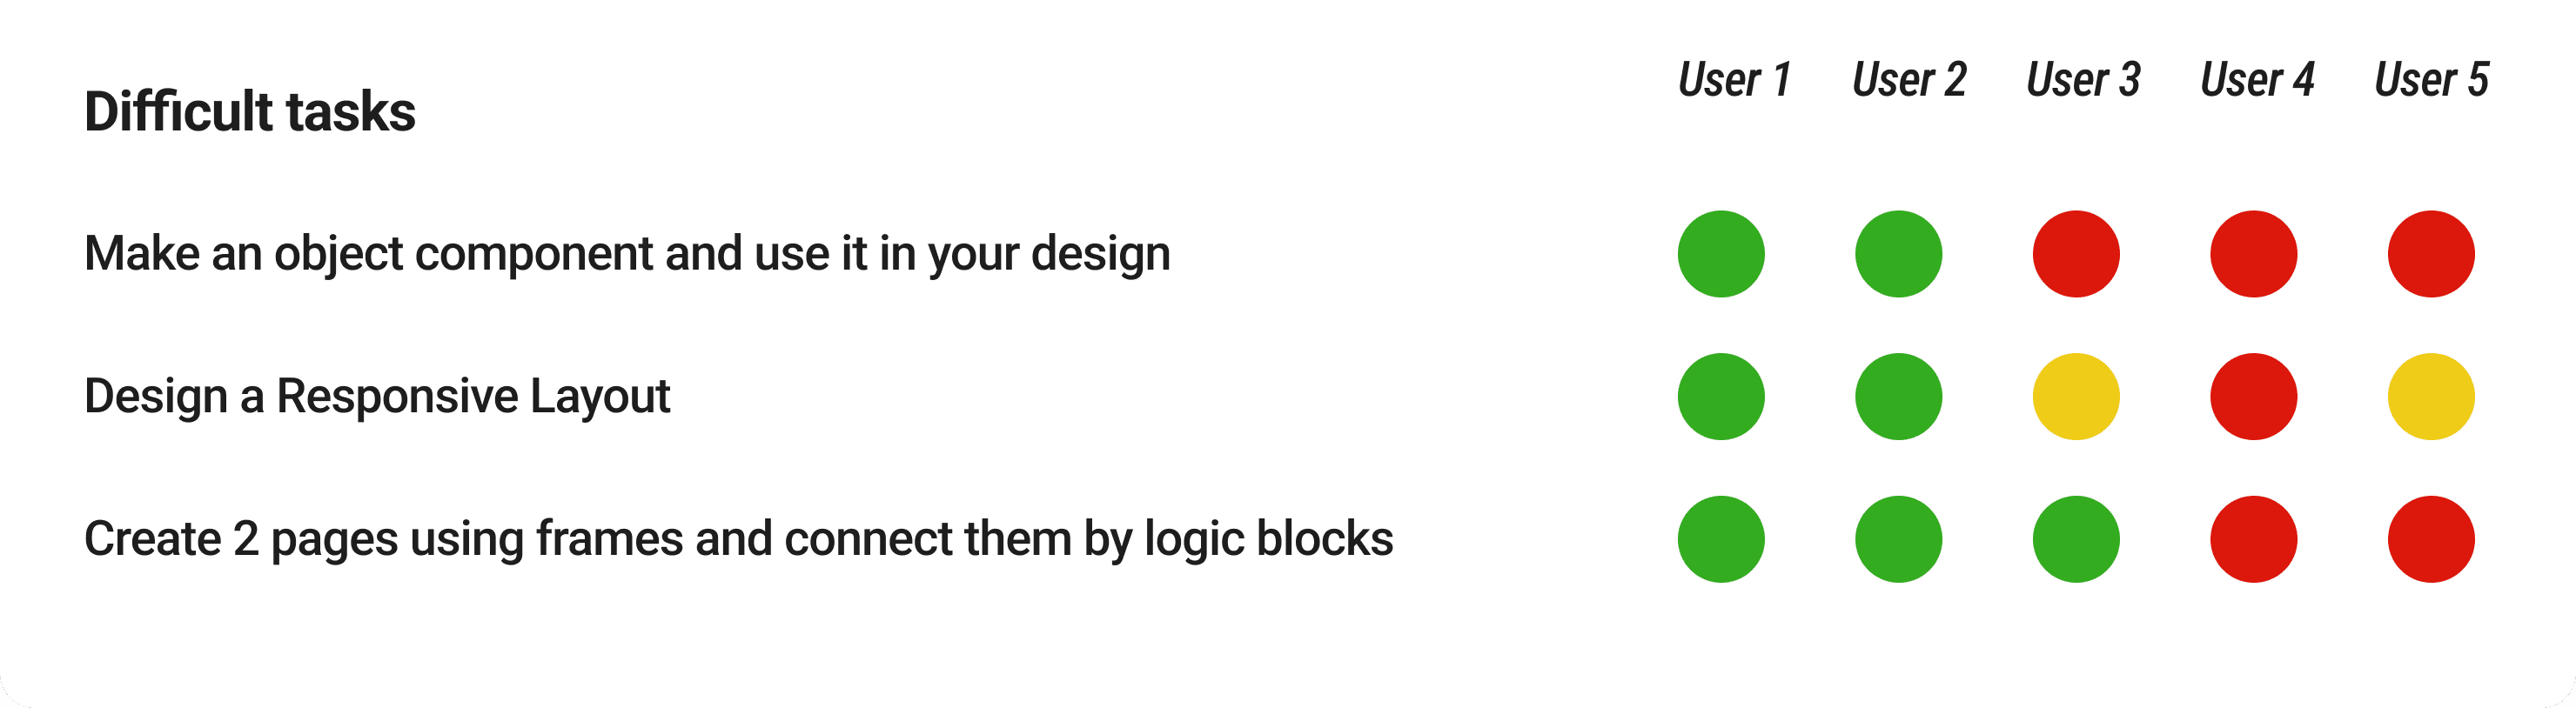
I defined 3 types of design tasks: Simple, Moderate and Difficult and also defined the criteria for successful and unsuccessful task completion, such as the expected outcome, tool discoverability, time on task, and the number of errors.
NB: Due to constraints such as time and budget, I limited this research. However, with more resources, it would be beneficial to conduct this research across different segments of users (For example designers, developers, …), with 4-6 usability sessions per segment until data saturation is achieved.

Heuristic evaluation
I conducted a heuristic evaluation using the 10 Nielsen and Norman usability heuristics to systematically identify usability issues across the platform. Several key problems surfaced during this evaluation:

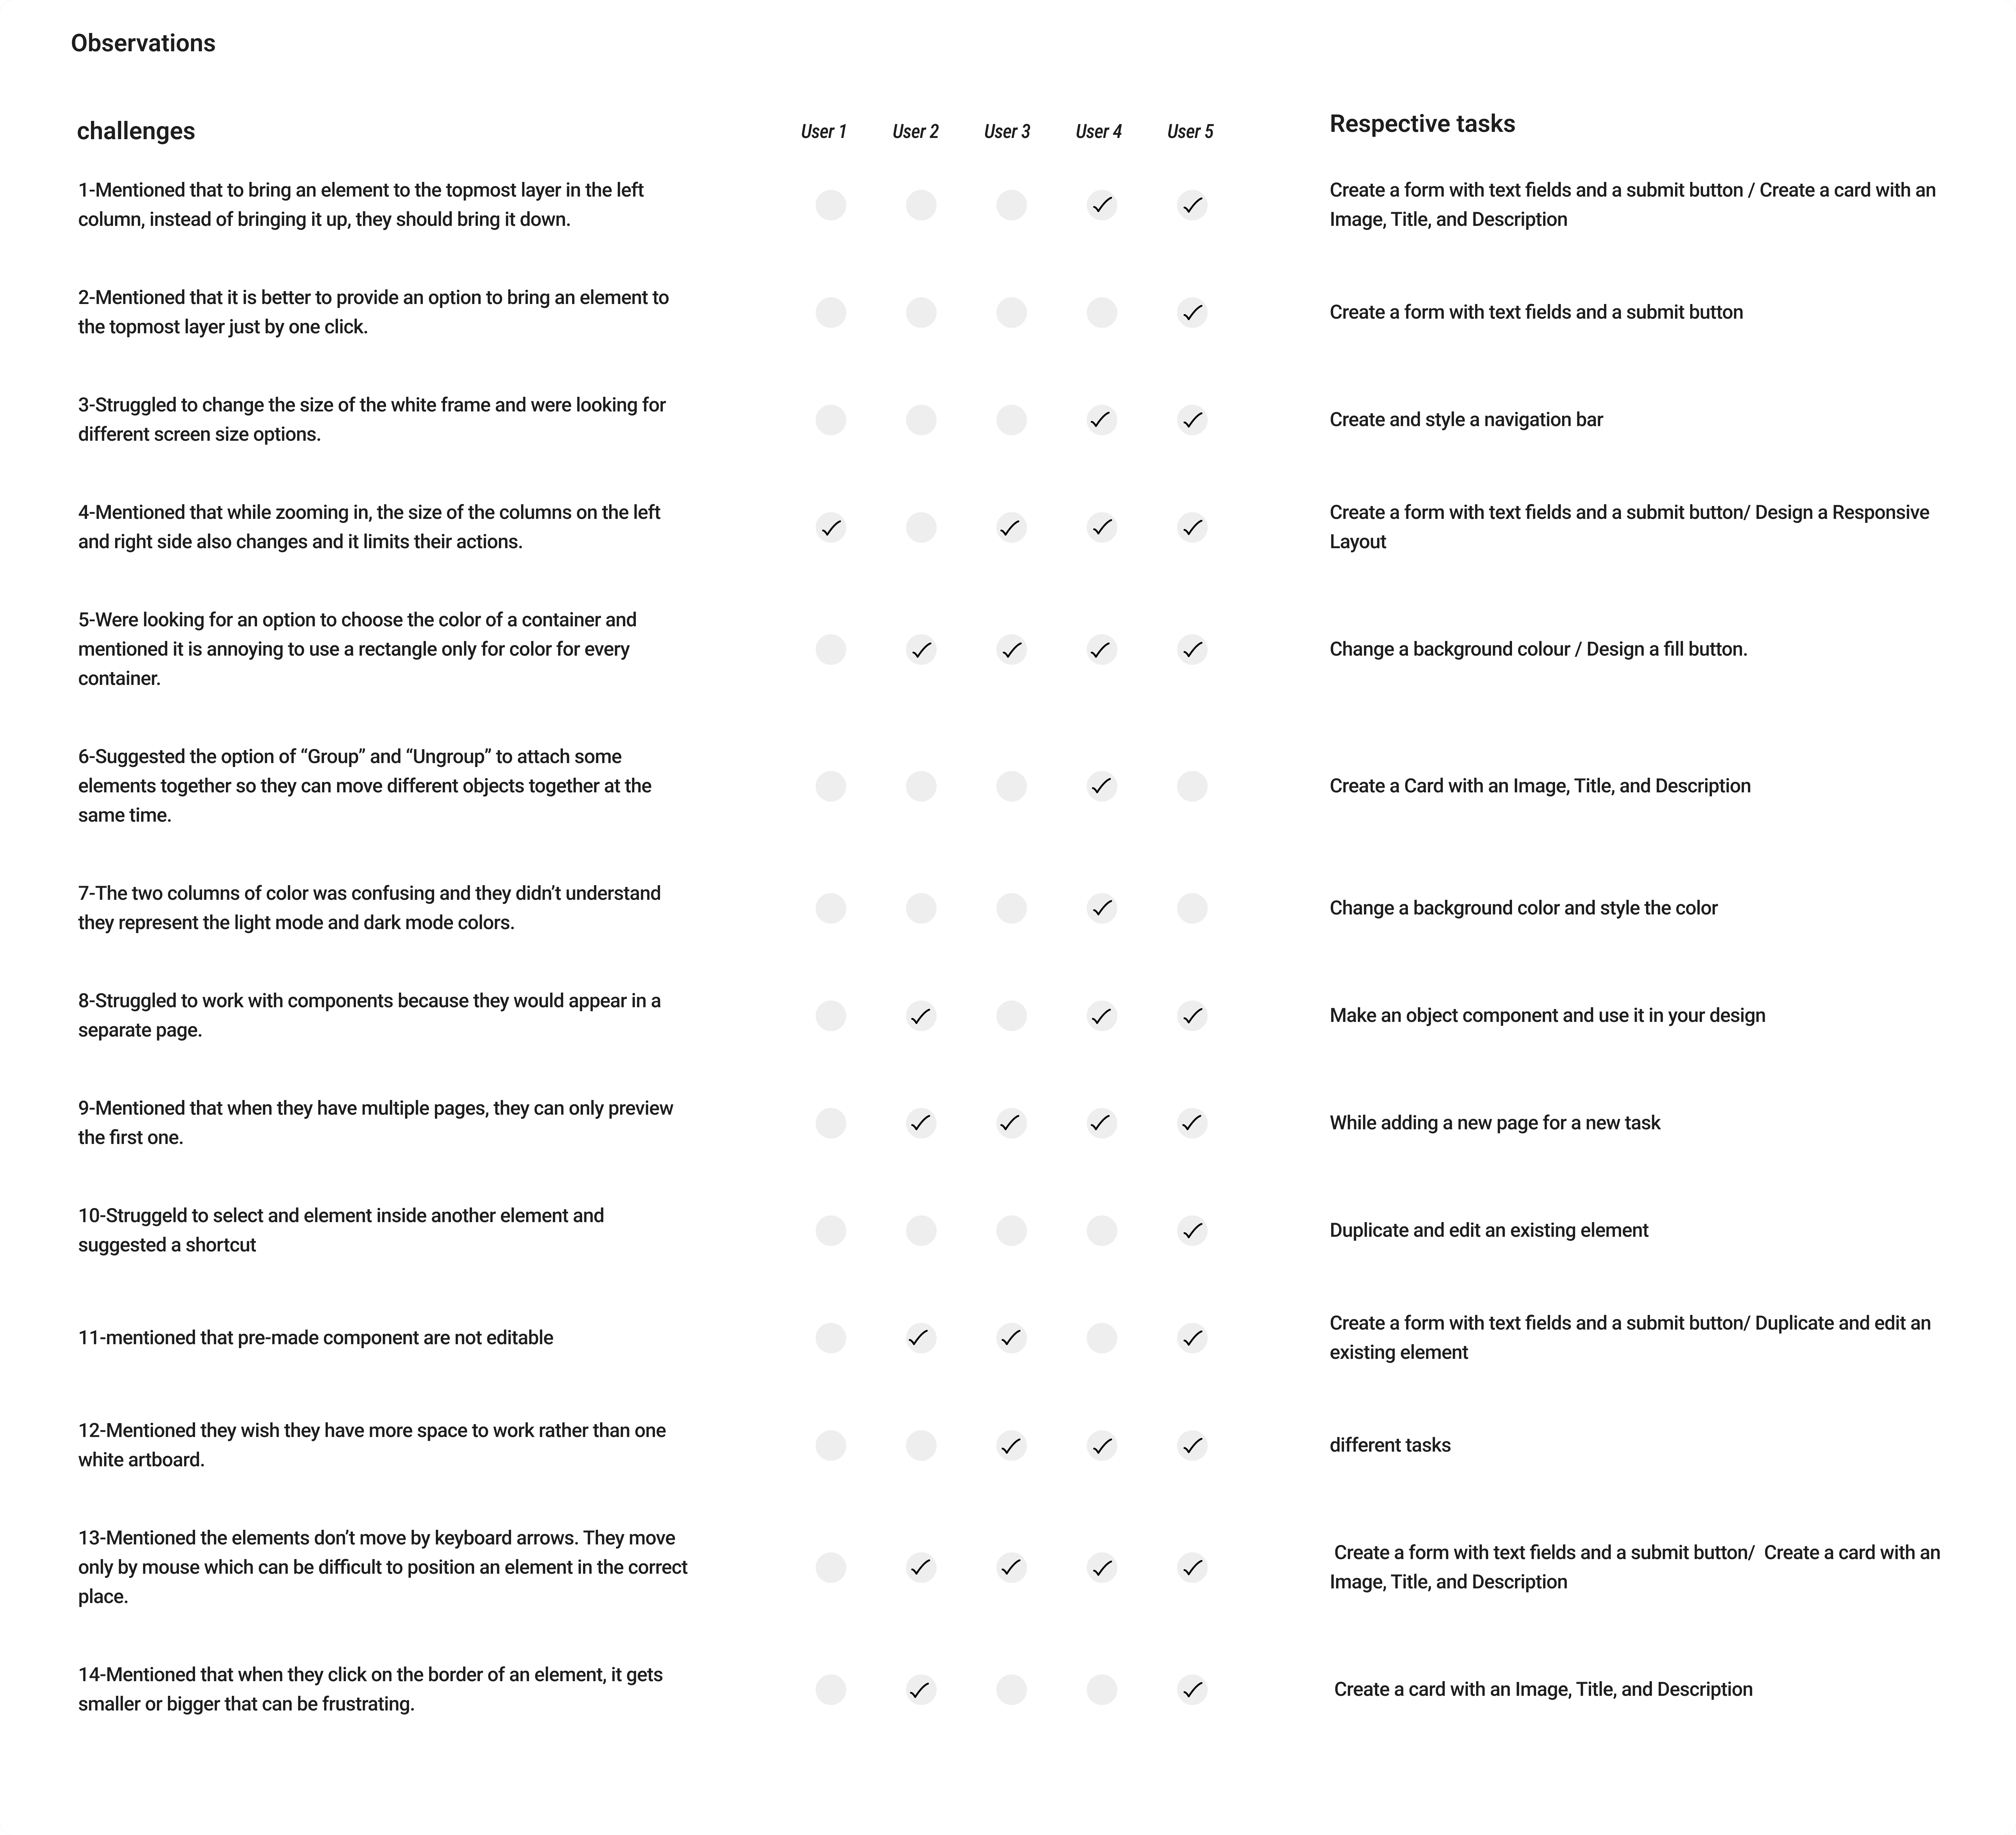
Main problems
1)When the user uses the container tool, they are not able to choose the color and only by adding the rectangle tool they can have a color.

2)While zooming in, the size of the columns on the left and right side also changes and it limits user's actions
3)Users have to click on the component in the workspace to go inside it and edit it but in the layers stack under the components list, this action is not possible. So, users can only select a component from there and drag it to their workspace. In this case, users have to remember all the components by name because they are not clickable.


4)On each page, there is a white board in the middle of the work environment. All the actions are limited to this white board
5)To bring an element to the topmost layer in the left column, instead of bringing it up, users should bring it down which does not align with their real life mental model.

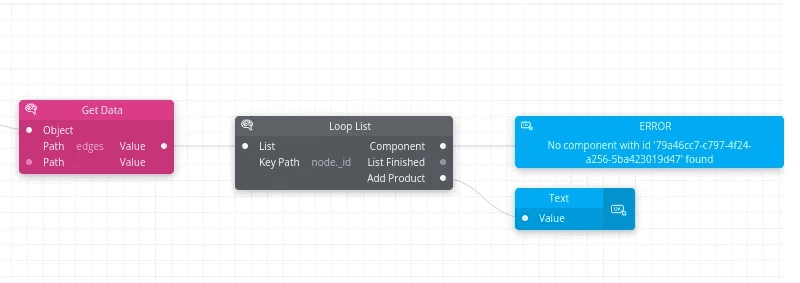
6)The "Loop list" block and the "Reduce list" block can be double clicked and users have to go inside them to add more blocks. But there is no UI element to show that they are clickable and this leads to errors while making logic.
Summery of findings and solutions
I created these charts to visualise the most important findings from previous research.

Impact-Effect Matrix
In collaboration with the team, we prioritized solutions based on their importance, frequency of occurrence, and development costs.
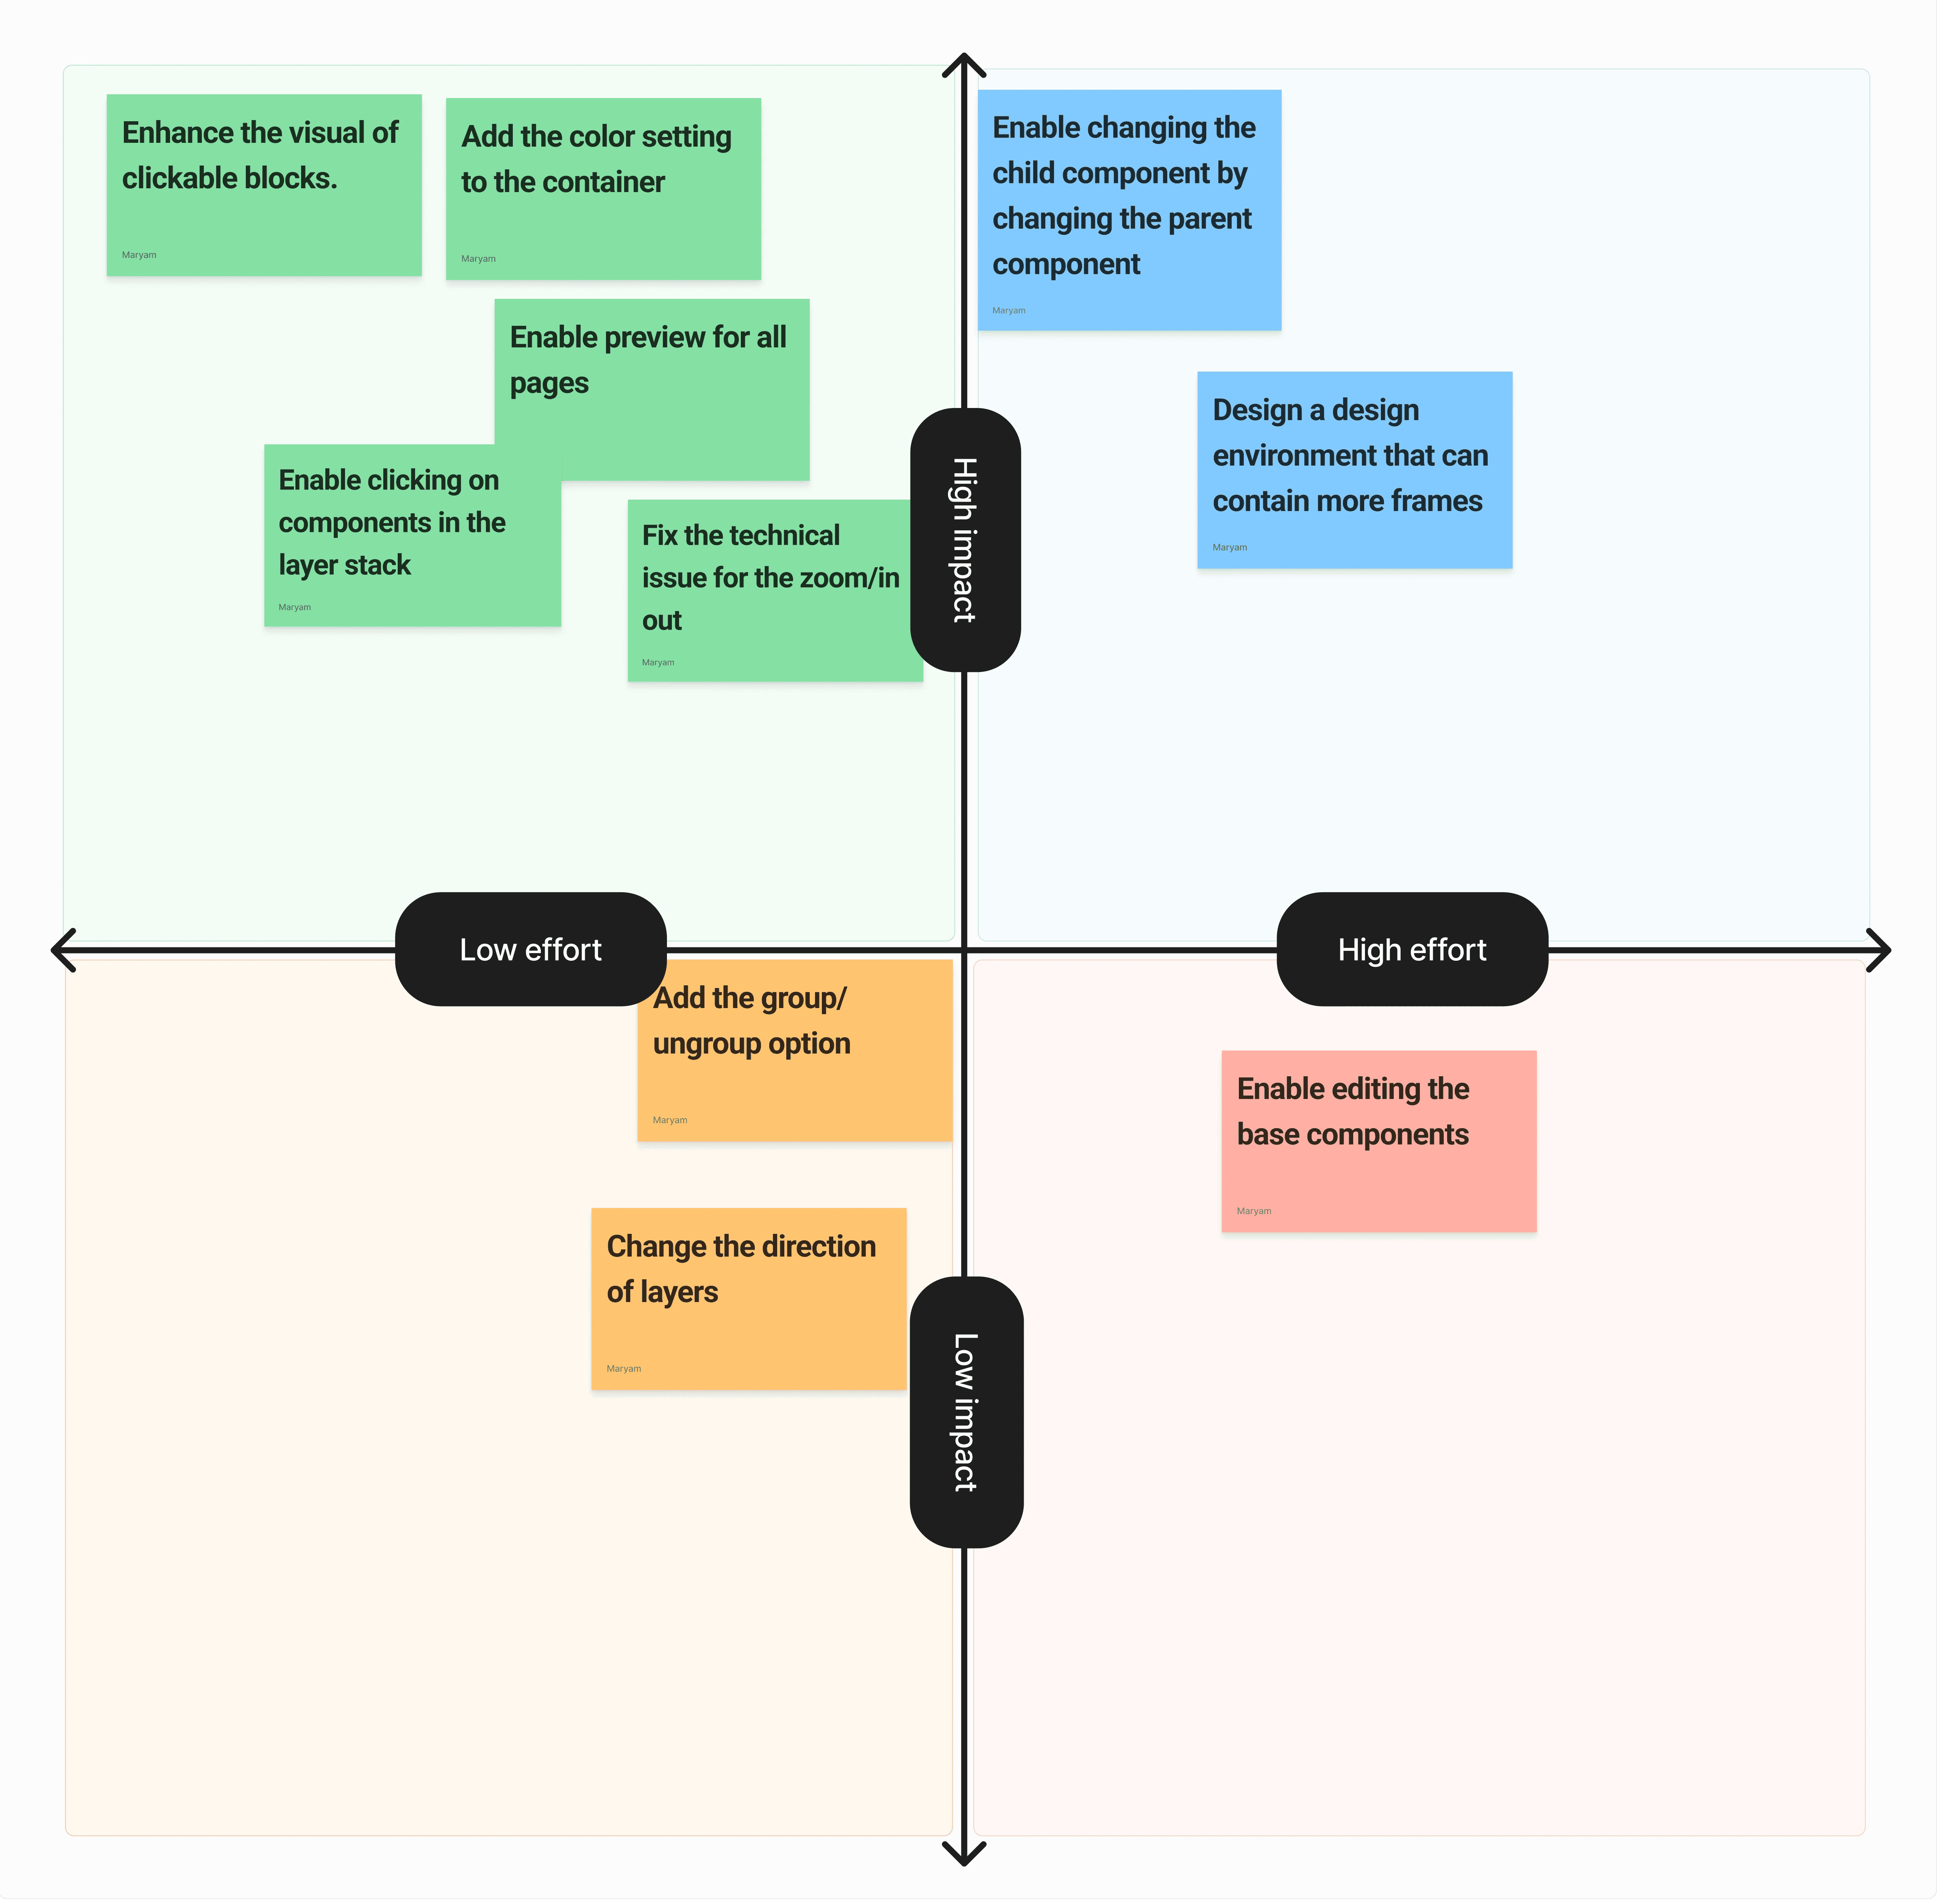
For the first phase, the team focused on the high impact/ low effort actions:
1) We added a background setting to the container
Now, users don't have to use a rectangle for every container element.

2) We fixed technical issues
We fixed the zoom in/out function, enabled preview for all pages and enabled moving of elements by keyboard arrows.
3) We improved the user experience of working with components
We implemented the ability for users to click on components directly from the components list, making it easier to select or edit previously created components. Additionally, I designed a prototype for an image-based component search feature, but after reviewing it with the product manager, we concluded that the added value did not justify the development effort.
3) We changed the interface of clickable blocks.
I began by quickly designing multiple potential solutions. Next, I conducted A/B testing to determine the most effective UI improvement.

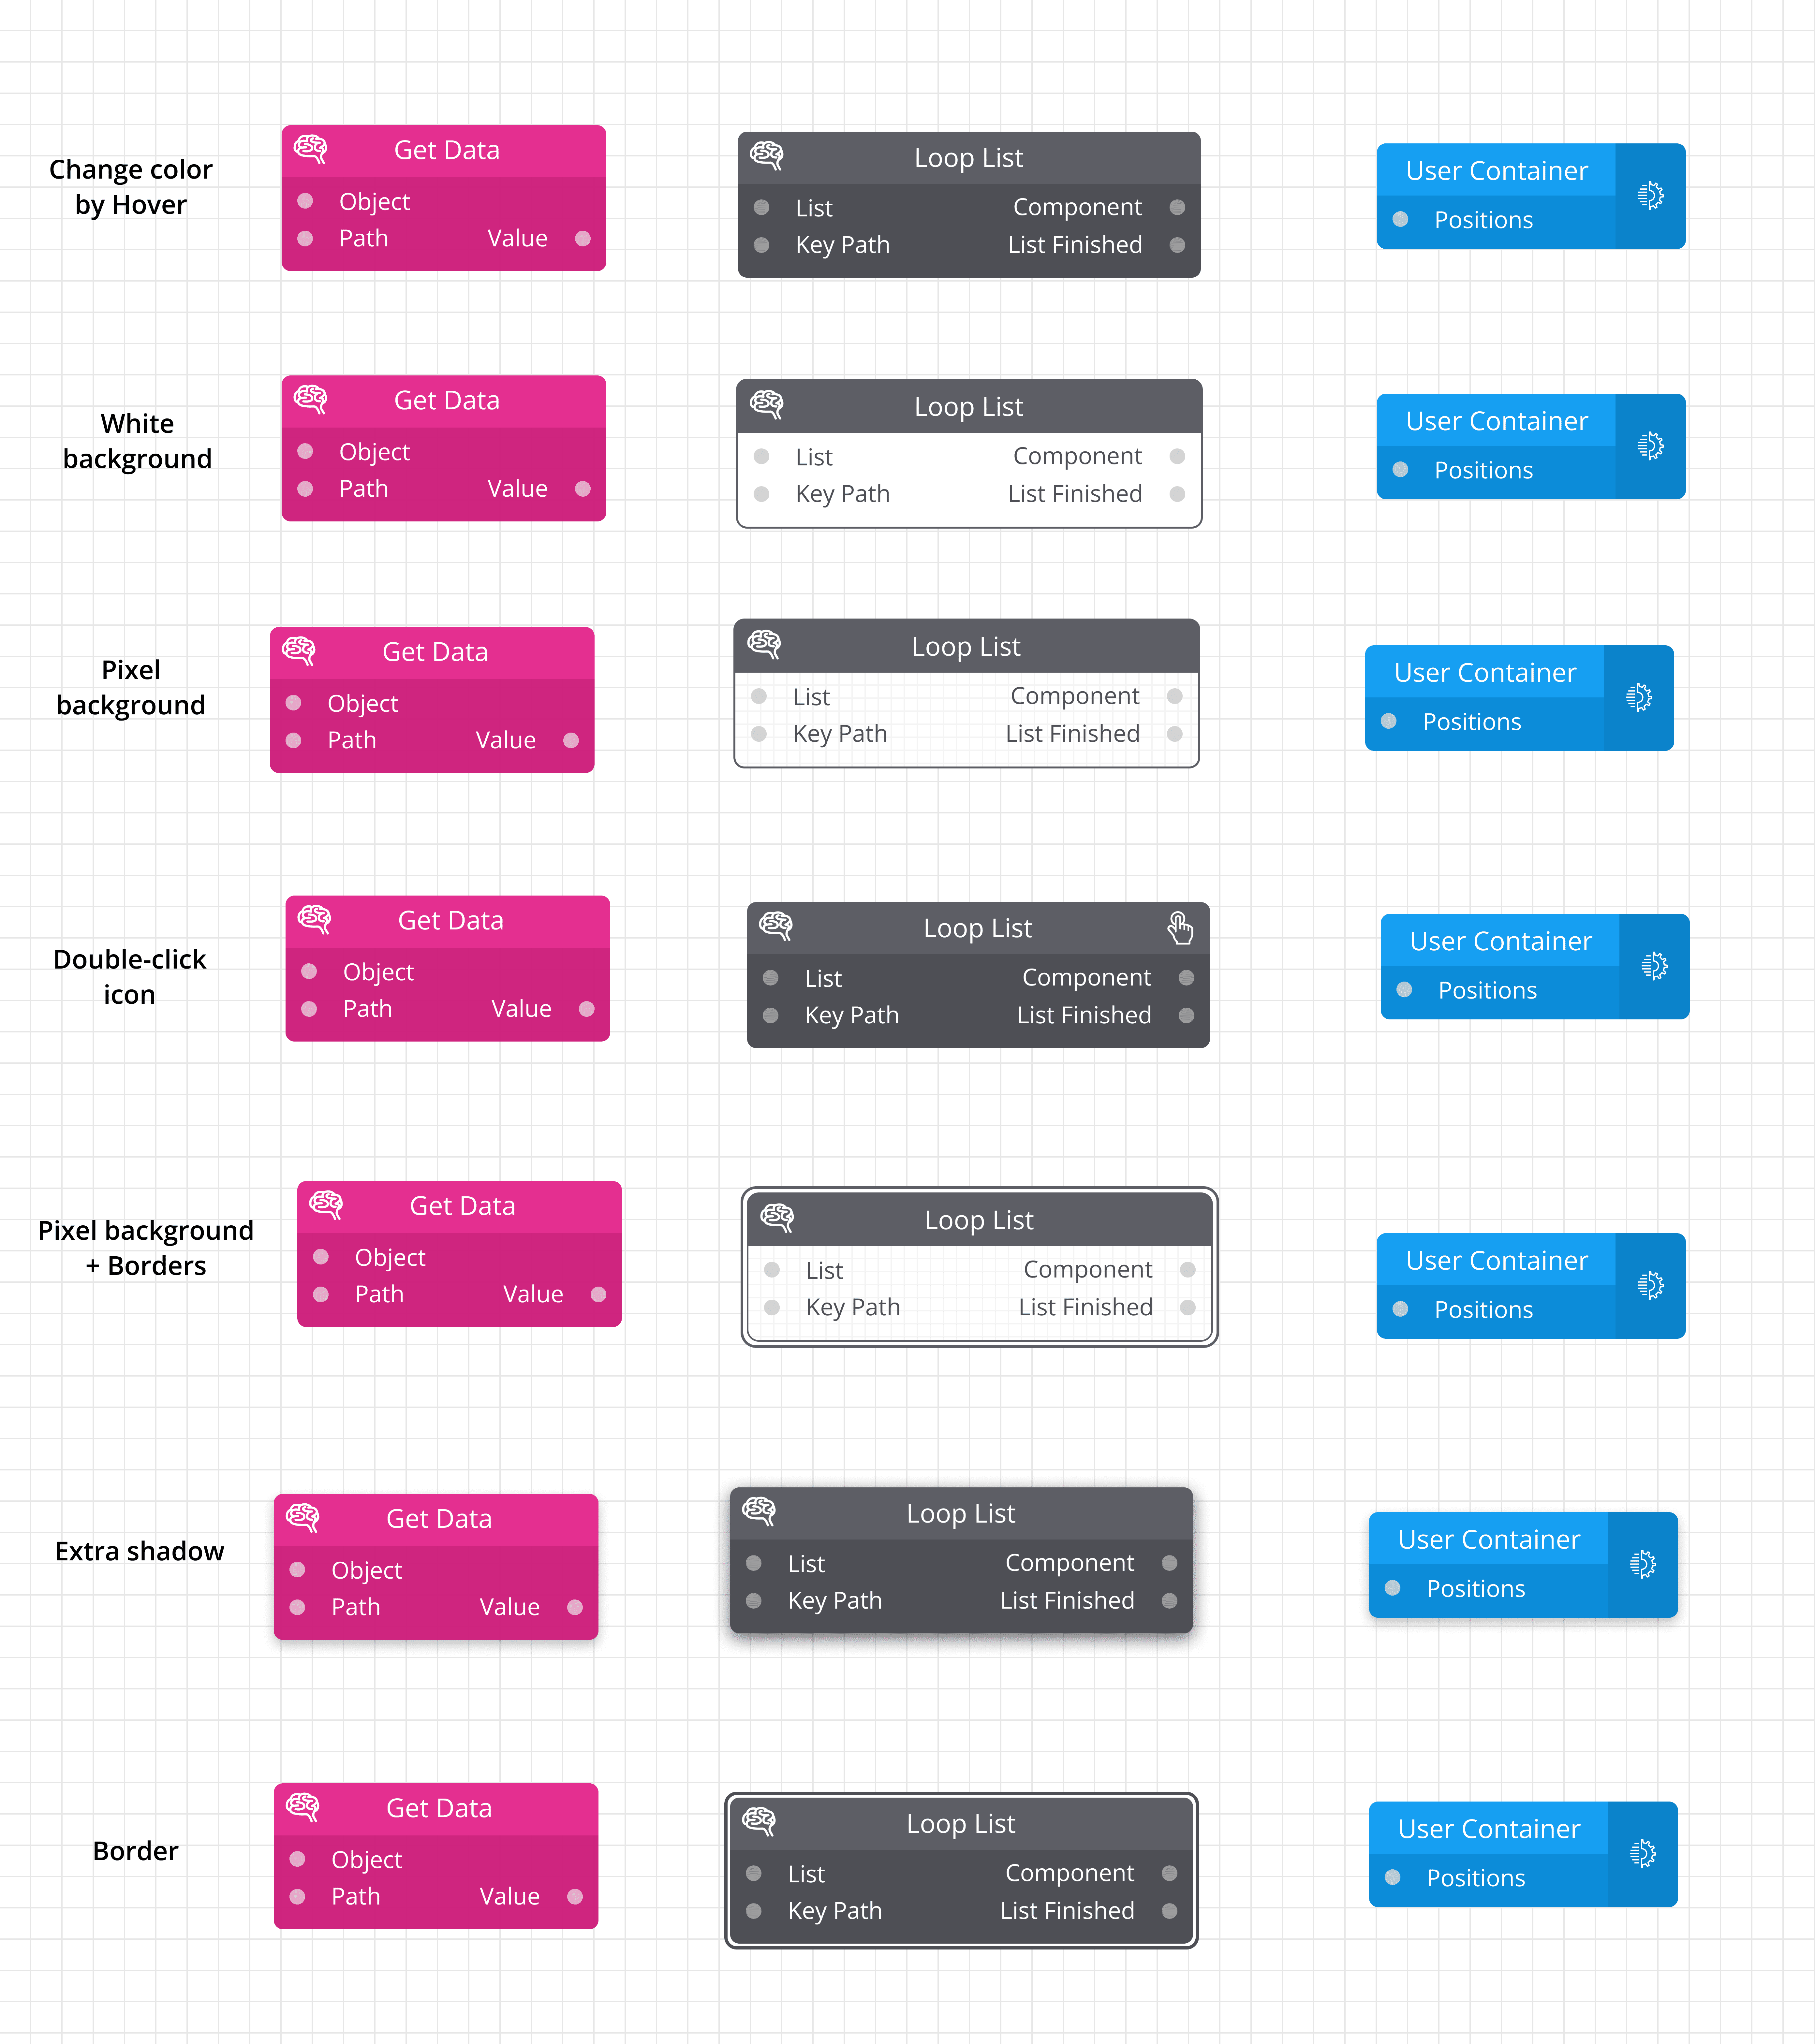
A/B Testing
1)Hypothesis and metrics
If we enhance the visual cues for clickable blocks by adding borders, changing their background color on hover, and incorporating icons, the Click-Through Rate (CTR) will increase, leading to less user errors.
2)User testing
I designed variants with improved visual cues based on the chart and asked 6 users to interact with them, providing feedback on which ones they recognized as clickable.
3) Final decision:
Next, I evaluated the two winning options and I selected the “Pixel background block” solution. While the alternative choice would maintain consistency with other blocks in the same group by keeping the background color gray, I wanted to ensure the best user experience not the best UI. Users need to easily find which blocks are clickable in the overview, especially when there are many blocks displayed.


Constraints and How I Coped with Them
1. Limitations of quantitative analytics tools
Pluxbox's dynamic interface—where users can frequently add, remove, and rearrange UI elements—posed challenges for analytics platforms like Microsoft Clarity. To navigate this limitation, I focused on qualitative methods.
2. Time and resource constraints
Given time and resource constraints, we utilized an Impact-Effort Matrix to prioritize solutions. Also,
With additional resources, it would be beneficial to conduct usability testing across different user segments (e.g., designers, developers), with 4–6 sessions per segment, to achieve data saturation and uncover a broader range of usability issues.
What’s next?
Due to time and effort limits, we focused on the most important improvements in this phase and couldn’t include some features, like more advanced customization for components or making the artboard more flexible. However, the team plans to add these in future updates to make the platform even easier to use.
Next projects

Carbon Footprint
Designing an app to reduce the carbon footprint of phone usage for Fairphone.
